Application observability
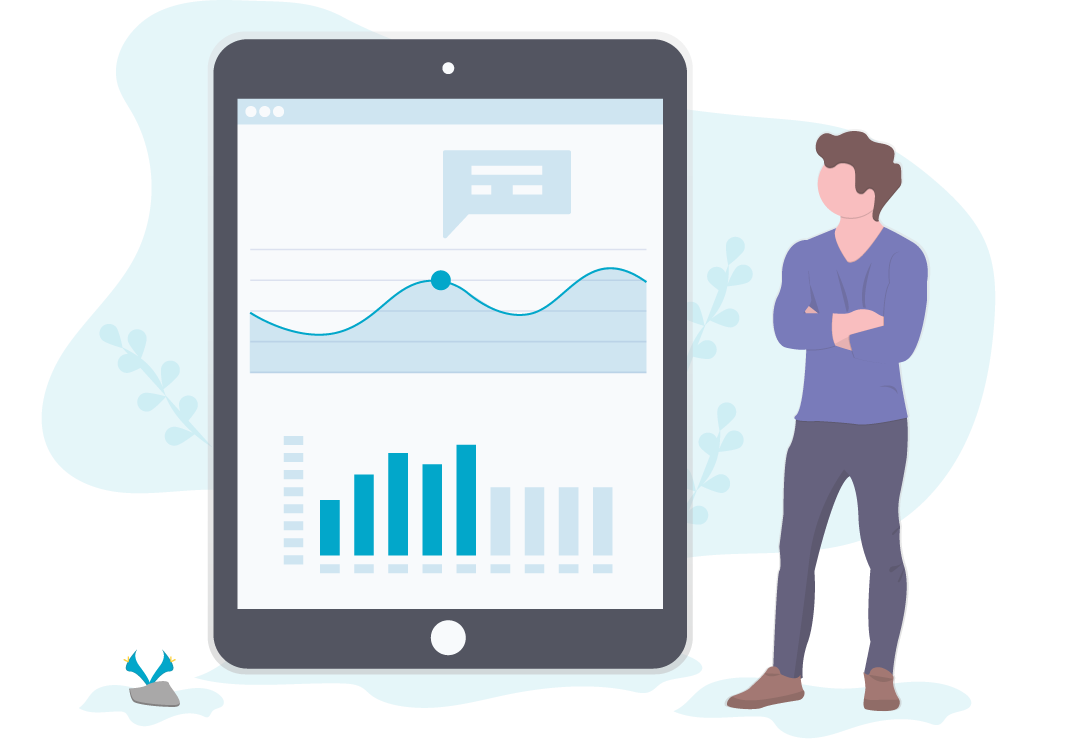
Application performance monitoring enables you to understand why your application is slow or broken and learn what needs to be done to improve performance.
ASSESS
We help you understand your current state and create a roadmap for you to develop your observability maturity.
BUILD AND MAINTAIN
Based upon our proven ecosystem, we build a custom observability platform and unburden you from its maintenance.
EXPAND
We improve your current monitoring system and expand it with proven open source tools for advanced observability.
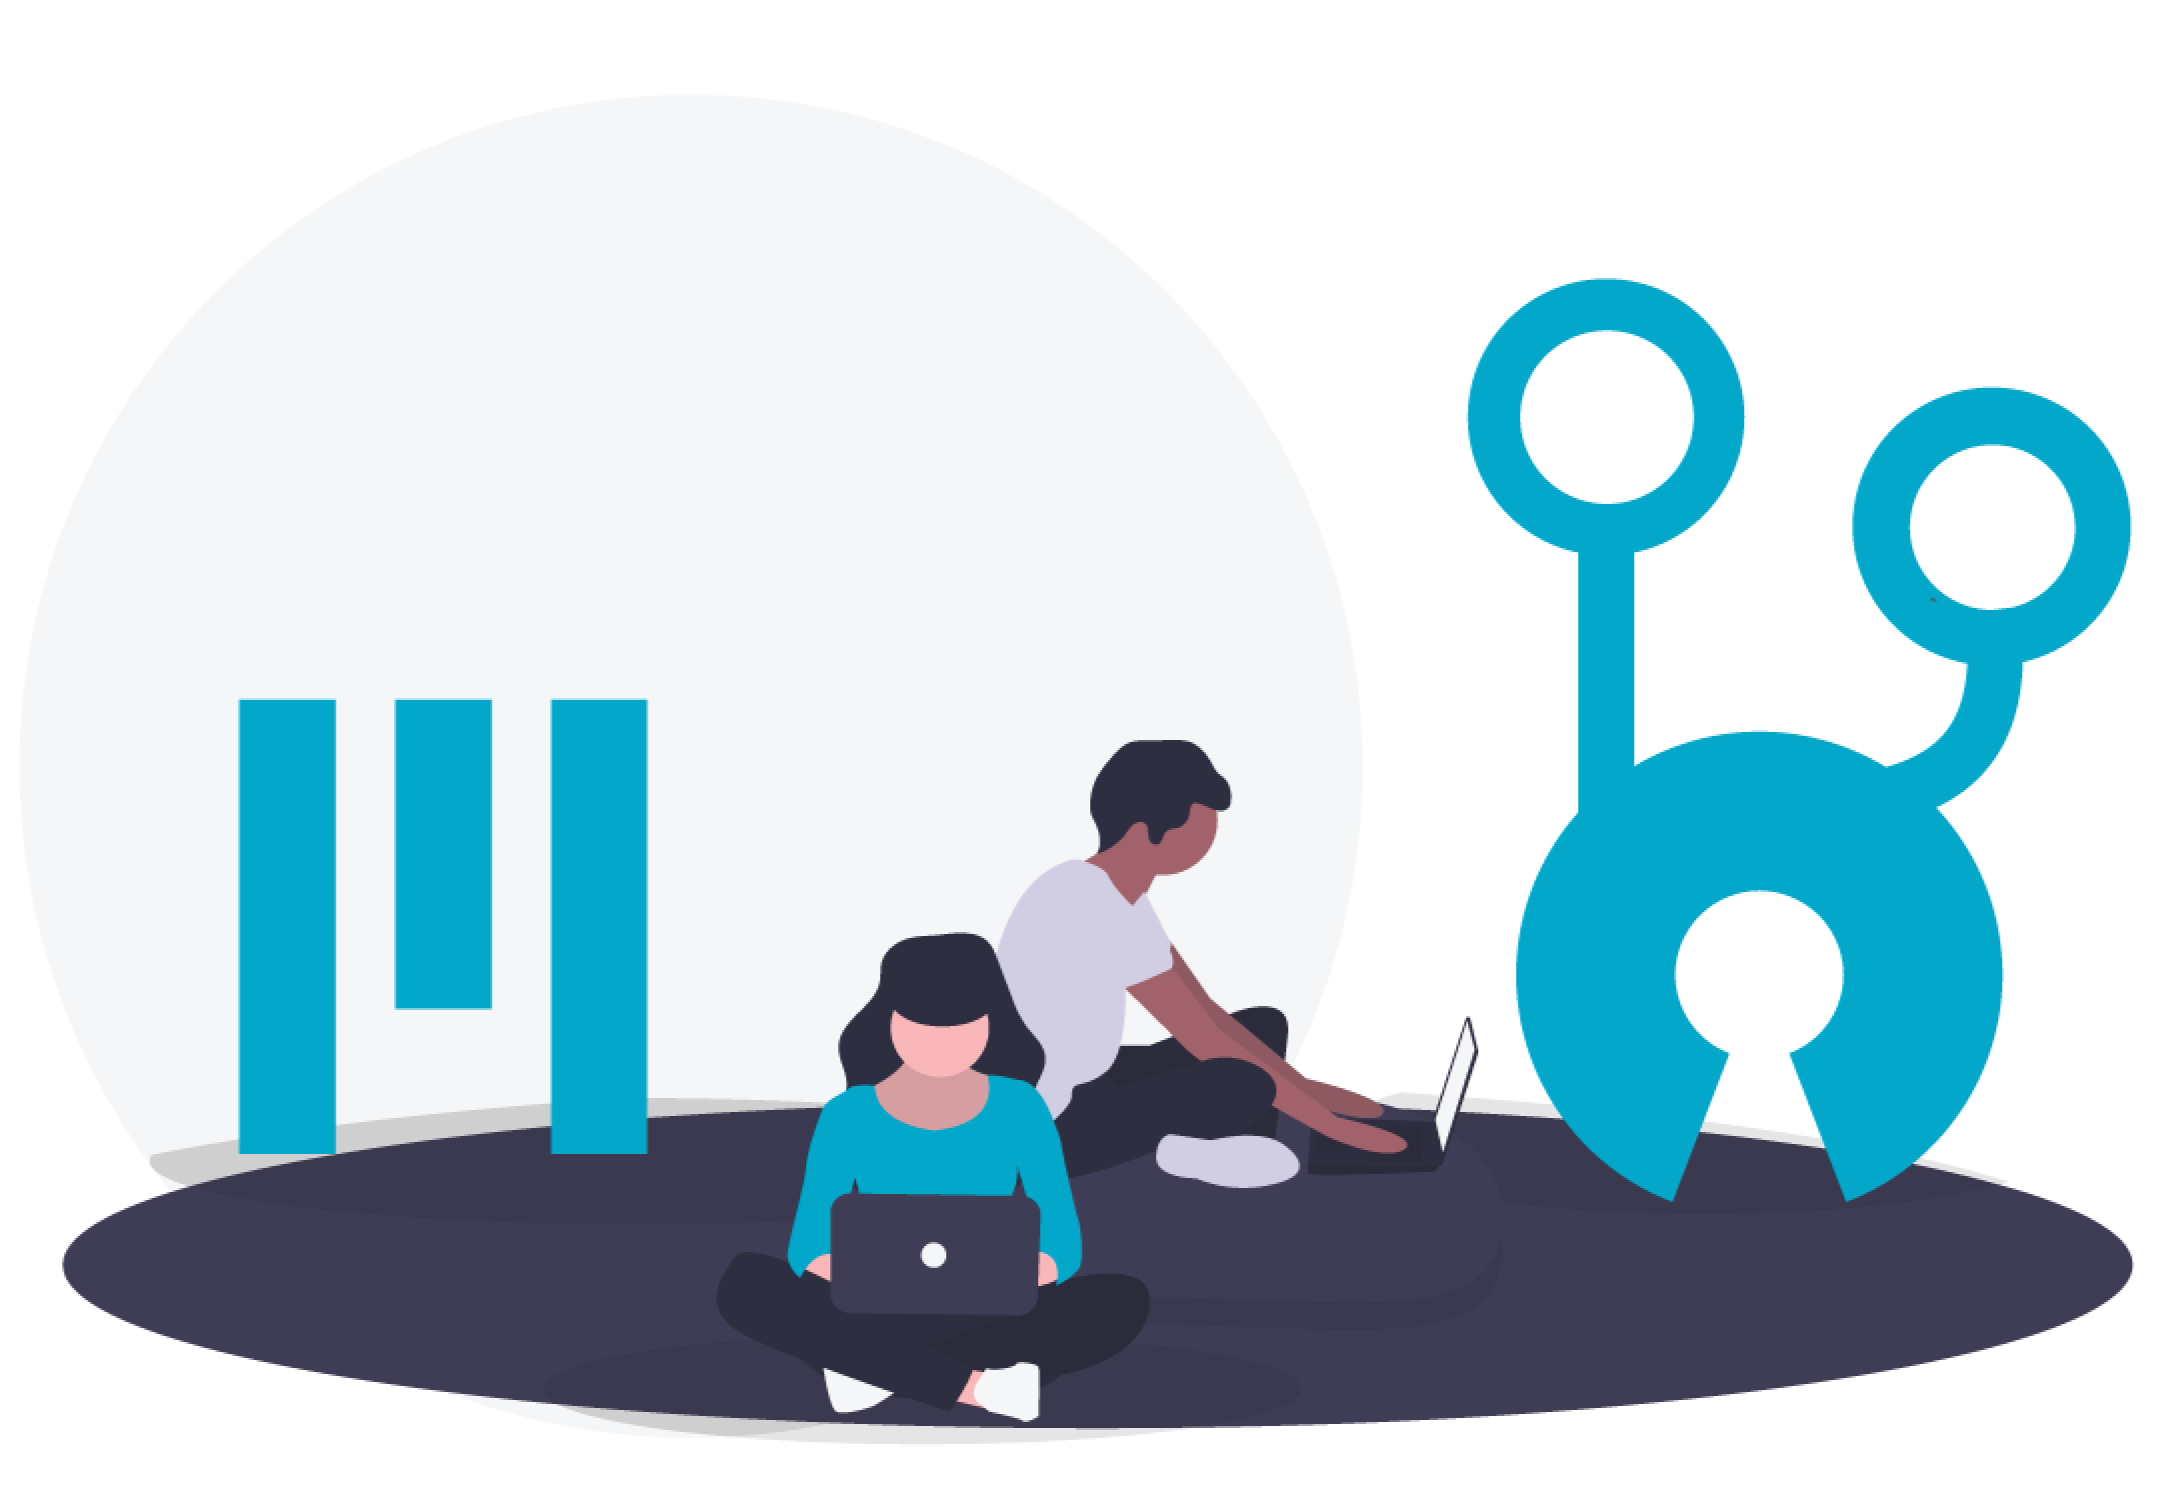
Build reliable applications
- We monitor your data while you focus on building your application.
- We guide you in setting up and maintaining your own observability stack.
- We assist your development team on getting all the metrics you need.
Observability tooling
We use a set of proven Open Source tooling for your observability platform. With our experience in DevOps, we know how to run these tools, whether it is on a cloud provider, on-premise, or on the Inuits infrastructure.
JAEGER
Jaeger is a tracing system used for monitoring and troubleshooting microservices-based distributed systems.
</p>
PROMETHEUS
Prometheus is a monitoring and alerting system allowing you to collect metrics and to create alerts with your metrics.
</p>
CORTEX
Cortex provides a horizontally scalable, highly available, multi-tenant long term storage solution for Prometheus.
</p>

Inuits contributions
Inuits contributes code and time to the Prometheus and Grafana project, helping it grow and meet users’ needs. Julien (open source consultant at Inuits) is a member of the Prometheus team, involved in the community and the development of the ecosystem.