
Application environments are increasing in scale and complexity and your logs, metrics, and traces are coming from many different databases and back-ends. Inuits can help you monitor your infrastructure and your applications, and take the path forward to observability.
Observability gives you insights into the state of your services and maps all the different components communicating with each other. You learn more about your application and the code that achieves your business targets. Logs, metrics, and traces are displayed over time, and with mathematical patterns, you learn how to improve your the services you offer to your customers.
Application observability enables you to understand why your service is slow or broken and learn what needs to be done to improve performance. Observability doesn’t stop with the state of your application but can also give you insights into your business targets. Based upon your KPI’s, metrics are collected and displayed on an easy to read dashboard.
Monitoring vs Observability
Before diving into what observability is, you must know how it differs from monitoring. Monitoring means running active checks on a set of services and technical components to check their health. Monitoring gives you answers to questions you known upfront. The questions generally asked by the monitoring are:
-
Is the service available and used by customers?
-
Is the service providing correct answers (and not errors)?
-
Is the service providing answering fast?
-
Is the service able to process its backlog in time?
Once you have the answers, the next question is “why” do you have those answers. But those questions are not predictable upfront. Observability is the ability to answer those questions, which are not known upfront, without adding new code. In an observable stack, you can see the world as your application sees it. You can understand where it spends its time and how it interacts with the other components.
Three key factors to successful observability
1. Culture
Culture plays a tremendous role because observability brings you those cross-components views. It fits very well in a DevOps world of developers being involved in the deployments and the maintenance of the applications. Similarly, Operations teams will more likely understand observability data better and react more appropriately.
2. Observe all environments
Observability hits all environments (development, acceptance, and production). When observing all environments, you can see problems before they hit the production environment. Moreover, it is easier to reproduce issues outside of production and to understand how it behaves.
3. Tooling
Developers don’t want to code specifically to add observability into their application. They are willing to do a small part given the benefits they would get but will not spend 50% of their time in observability development. Therefore, when choosing a stack or libraries, it matters to pick the ones that are easily observables.
What are the benefits of observability?
-
Discover and pinpoint issues you don’t know exist: Observability enables you to better pinpoint root causes of your incidents and therefore resolve them faster.
-
Learn about issues early in the development phase: Monitoring in the early phases of the software development process lets you fix them before they impact your customer.
-
Better insight in your services: Observability empowers you to understand the relationship between your services and provides you insights about how they interact with each other.
How to start with observability
Step 1: The first step into using an observability platform is an intake workshop. We understand that every service is unique, and therefore it is essential to uncover the fundamental problem. During this workshop, we discuss your goals and introduce modern observability principles to achieve your goals.
Step 2: Based on those principles and your goal, we introduce and implement our observability ecosystem. With our experience in DevOps, we know how to run these tools, whether it is on a cloud provider, on-premise, or on the Inuits infrastructure.
- [Prometheus] (https://prometheus.io/)
- [Grafana] (https://grafana.com/)
- [Jaeger] (https://www.jaegertracing.io/)
- [Cortex] (https://cortexmetrics.io/)
- [Grafana Loki] (https://grafana.com/oss/loki/)
Step 3: Right out of the box, the toolset can collect much valuable information. However, to become truly observable, the back-end systems must be modified, and development teams must be coached to get all the metrics you need.
Step 4: Making your applications observable is a continuous process that will have to be observed and improved along the way. We will continu to improve, expand and maintain your observability platform.
How to make services observable?
To make your services “observable” you will have to collect metrics, distributed traces, and logs, better known as the three pillars of observability.
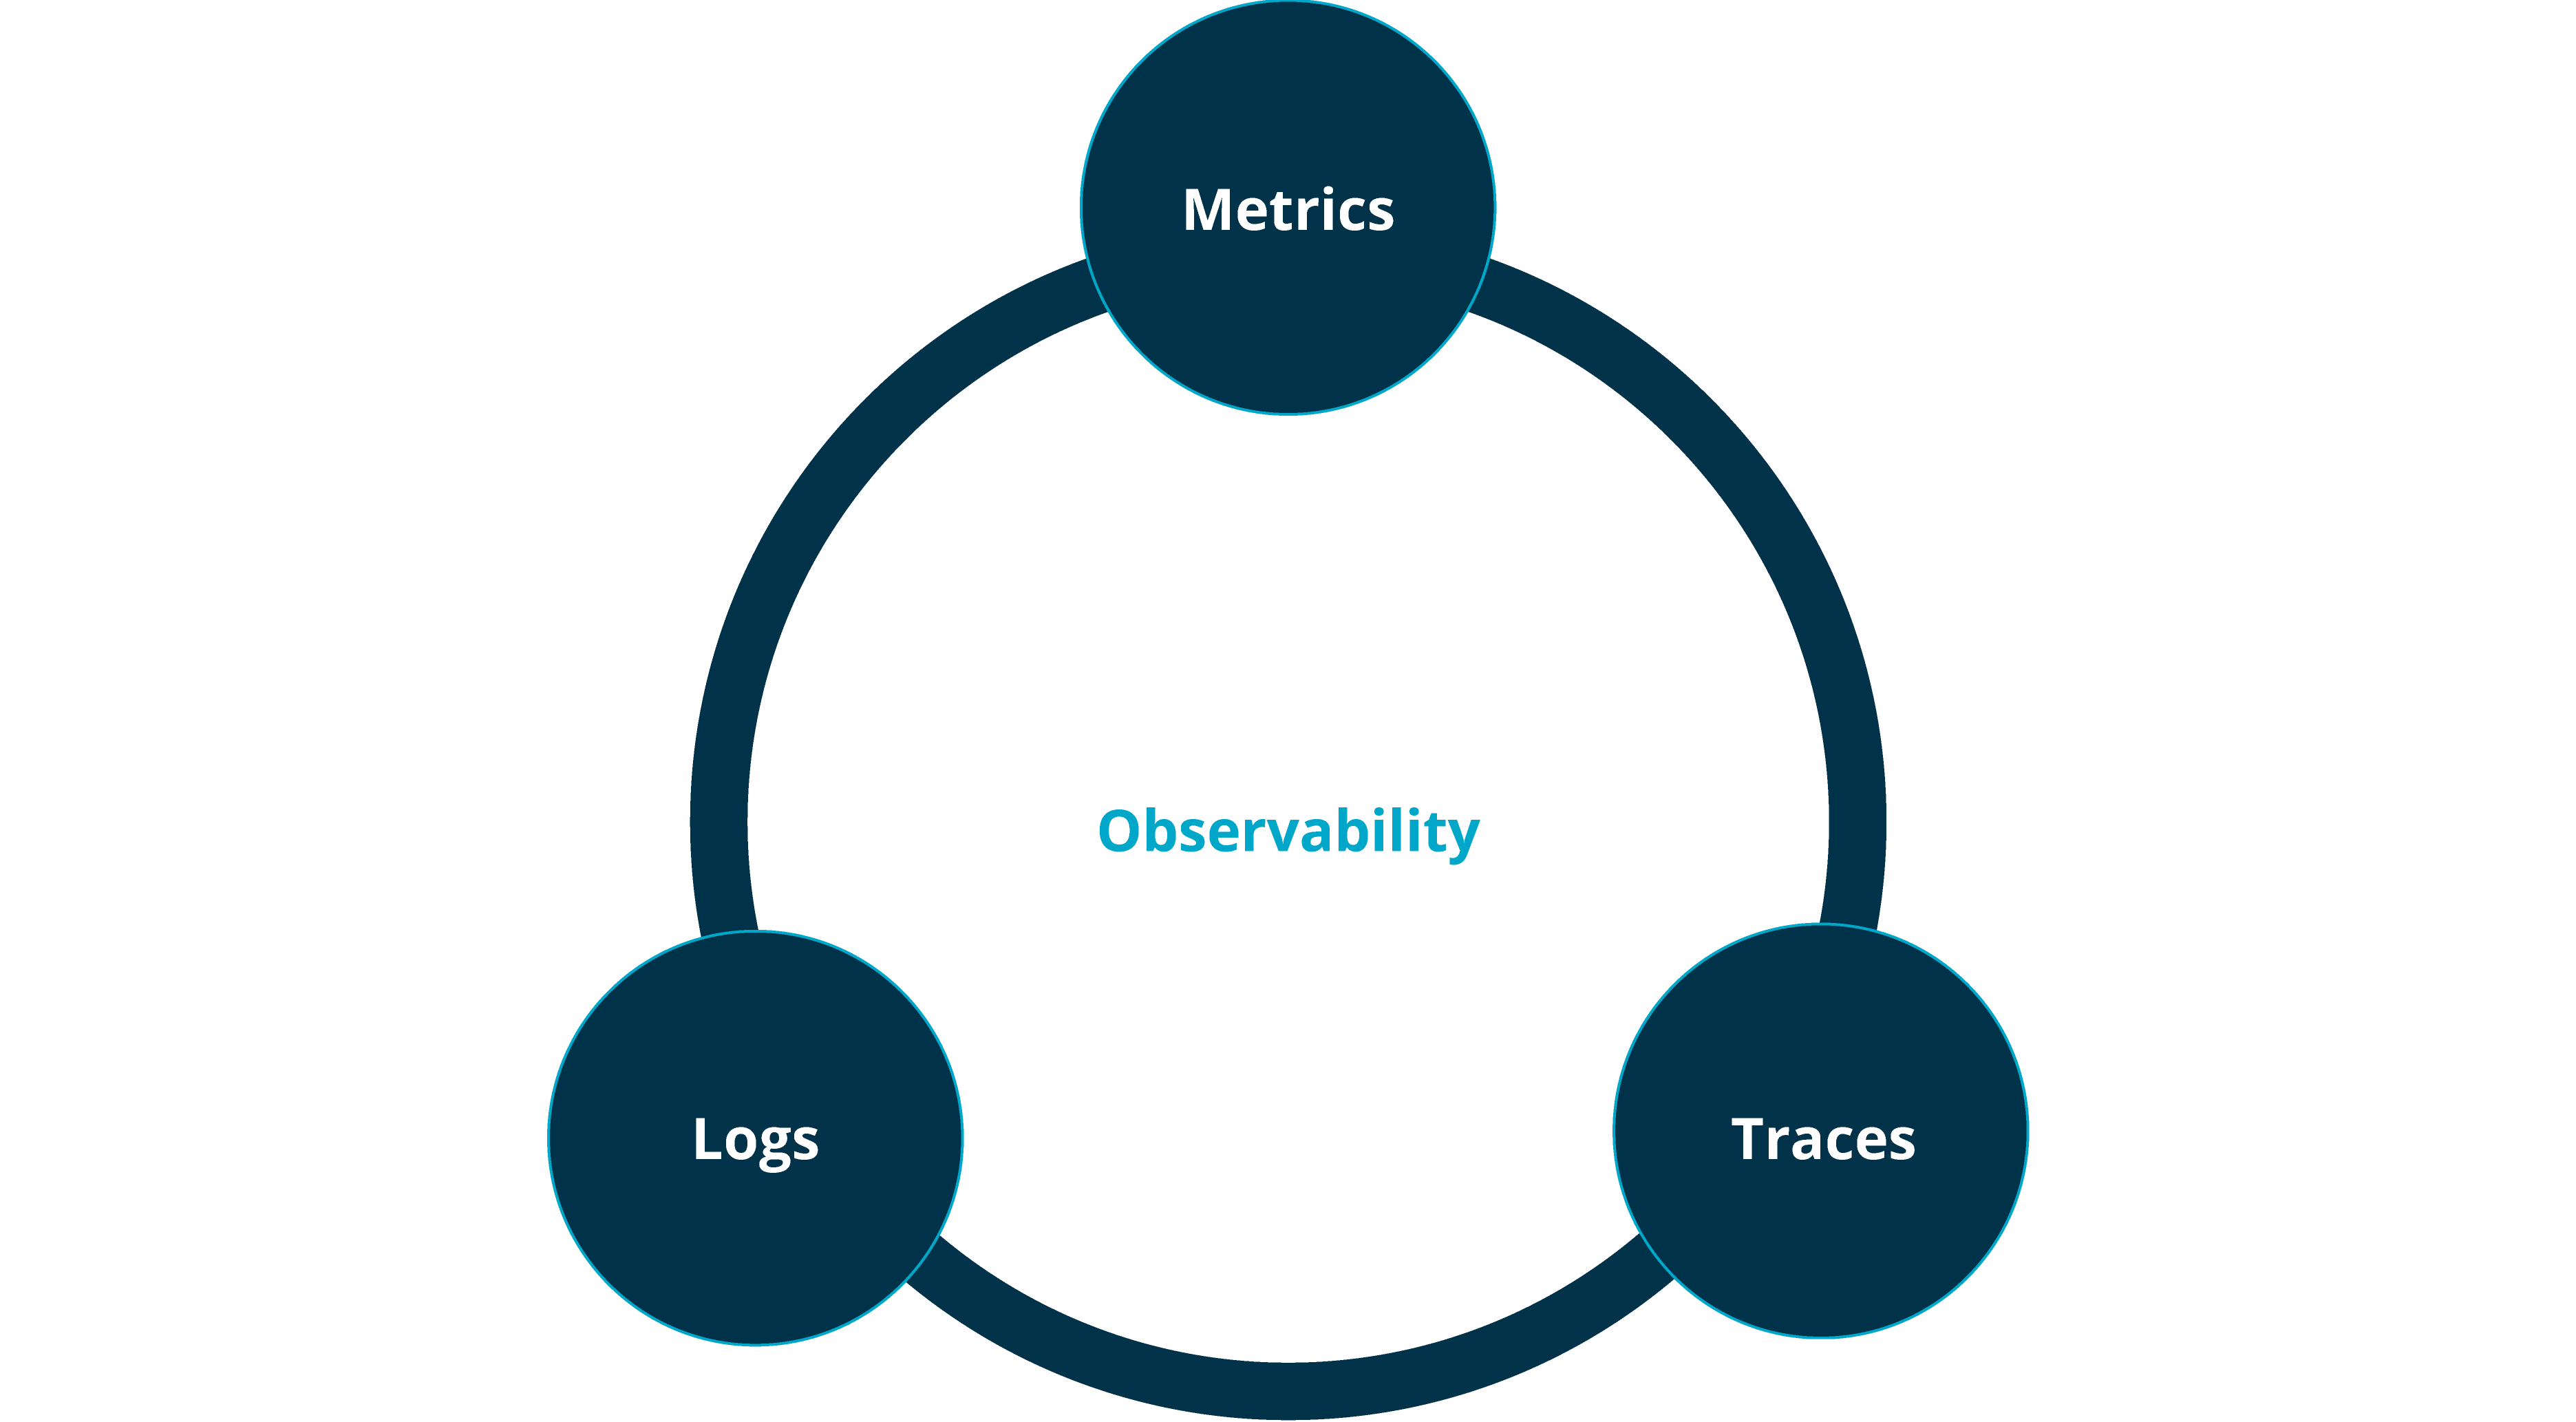
-
Metrics will tell you about performances and checks. It represents most of the monitoring parts.
-
Logs are per-application events that show you error messages and carry the voice of your applications.
-
Traces are small pieces of transactions that you can group around unique business transactions. A trace is placed into multiple microservices and can be split into various pieces in the same microservice.